Here’s a scenario that plays out thousands of times daily: a seller checks their listing, sees a competitor holding the Buy Box, and immediately slashes their price in panic. Five minutes later, they check again and see they’re back in the Buy Box. They assume their price cut worked. In reality, they were simply witnessing normal Buy Box rotation—and they just gave away margin for nothing.
The single biggest misconception among Amazon sellers is treating the Buy Box as binary: you either “win” it or you don’t. This black-and-white thinking causes sellers to misunderstand the sophisticated reality of how Amazon’s algorithm actually functions. And that misunderstanding is costing them significant revenue.
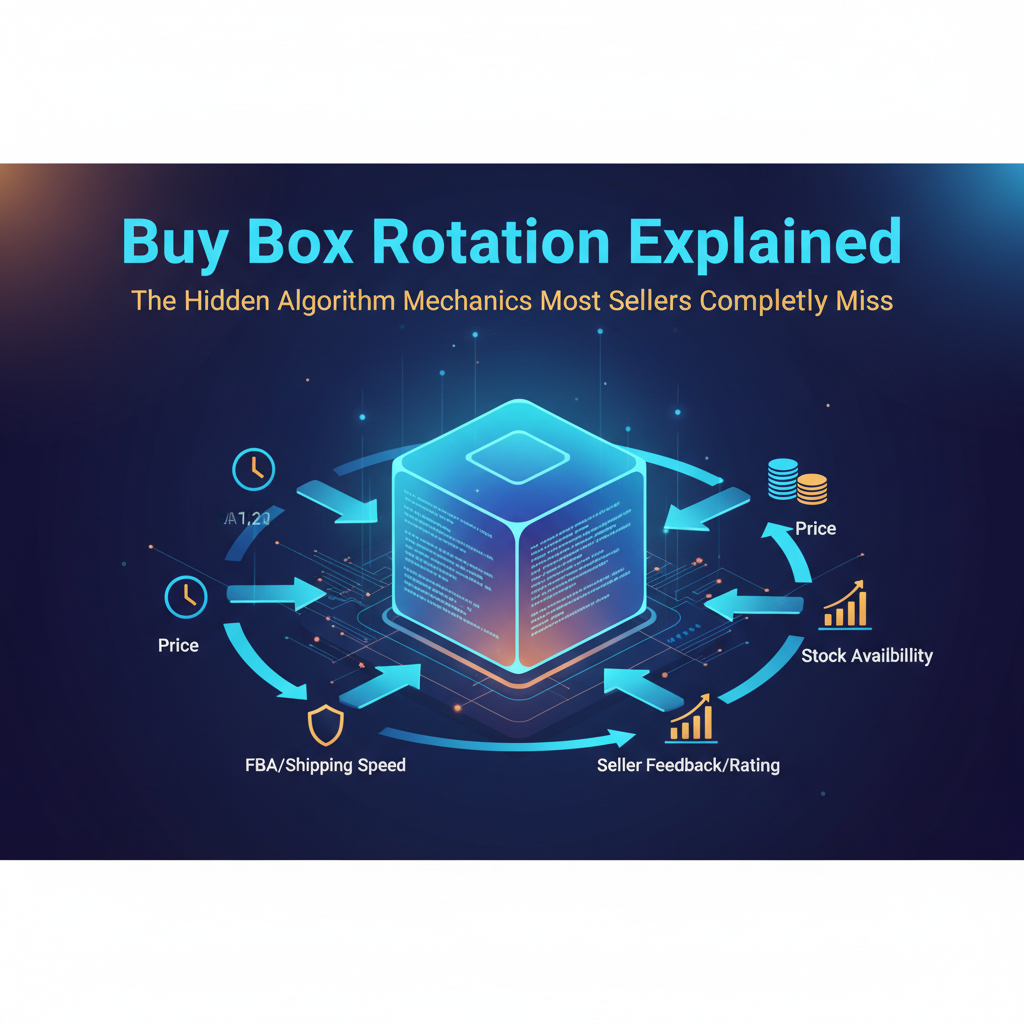
The truth is that the Buy Box isn’t a permanent crown that one seller wears. It’s a constantly rotating designation that Amazon assigns dynamically based on multiple factors that change by the minute, by the customer, by the location, and by the context. Understanding this rotation—how it works, when it happens, why it happens—is the difference between sellers capturing 70-90% Buy Box share and sellers stuck wondering why they’re at 30-40% despite competitive pricing.
What Buy Box Rotation Actually Means
Buy Box rotation occurs when Amazon alternates which seller’s offer appears as the Featured Offer, even when market conditions remain relatively stable. Multiple sellers can be “Buy Box eligible” simultaneously, but Amazon distributes Buy Box time among them based on weighted factors.
There are three distinct concepts sellers must understand:
- Buy Box Eligibility: Meeting minimum thresholds to be considered for the Buy Box at all
- Buy Box Win Rate: The percentage of time your offer actually holds the Buy Box
- Buy Box Rotation: The mechanism by which Amazon distributes Buy Box time among all eligible sellers
Research confirms this reality: “Instead of a single seller dominating, Amazon rotates Buy Box winners more often when multiple sellers have similar metrics.” When two or three sellers have comparable prices, fulfillment speeds, and performance metrics, Amazon splits Buy Box time between them.
Amazon rotates the Buy Box for several strategic reasons: testing which offers convert best for customer experience optimization, preventing marketplace monopolization, matching inventory proximity to customer locations for geographic efficiency, validating seller reliability under different load conditions, and discovering optimal price points that balance conversion with margin.
The 2025 Rotation Landscape: What’s Actually Changed
The rotation mechanics have shifted significantly this year. Where rotation might have occurred every few hours previously, it now happens as frequently as every few minutes when multiple sellers are closely matched. For items with nearly identical offers and seller metrics, Amazon actively runs A/B testing and rotates the Buy Box between eligible sellers.
Geographic-Based Rotation
The most significant change is geolocation-based rotation. If your inventory is closer to a shopper, your offer is more likely to win the Buy Box—even if your price isn’t the lowest. Amazon now rotates the Buy Box based on proximity to the customer.
This creates a situation where Seller A wins the Buy Box for customers in California because their inventory sits in a nearby fulfillment center, while Seller B wins for customers in New York for the same reason. Same product, same moment in time, different Buy Box winners based on location.
The visibility problem for sellers is significant: most only see their overall Buy Box percentage without understanding the geographic split. You might have 90% Buy Box share in the East and 30% in the West—with an average showing 55%—and wonder why it isn’t higher.
Delivery Speed Weighting
Delivery speed is now weighted at 25-30% in the buy box algorithm, up from approximately 15% in previous years. Sellers offering same-day and next-day delivery are seeing 18% higher Buy Box win rates. The algorithm prioritizes customer satisfaction through faster delivery over marginal price differences.
The Six Triggers That Cause Buy Box Rotation
Understanding what triggers rotation helps sellers optimize their share rather than react blindly to perceived “losses.”
Trigger 1: Near-Identical Competitive Positioning
When multiple sellers have prices within 3-5% of each other, the same fulfillment method, similar performance metrics above 99% ODR, and comparable feedback scores, Amazon rotates the Buy Box among them. The distribution might be 40/30/30 among three sellers.
What sellers misunderstand: they see 40% Buy Box share and think they’re “losing.” Reality: they’re sharing among multiple eligible sellers, and 40% might be the highest share available given competitive positioning.
Trigger 2: Amazon’s A/B Testing
Amazon constantly tests which offers convert better. The platform might give Seller A the Buy Box for 1,000 impressions, then give Seller B the same opportunity, measuring which converted better, which had lower return rates, and which generated better customer feedback.
Sellers interpret this rotation as algorithm instability or pricing issues when it’s actually Amazon’s testing mechanism. The critical implication: if your offer consistently converts better during your rotation time, Amazon gradually increases your share—even if your price is slightly higher.
Trigger 3: Geographic Proximity
When a customer in Seattle searches for a product, Amazon might favor Seller A with local inventory priced at $29.99 offering 1-day delivery over Seller B with Pennsylvania inventory priced at $28.99 but requiring 2-day delivery. The higher-priced seller wins because of proximity.
Sellers who automate pricing and inventory while localizing stock across multiple Amazon warehouses are outperforming competitors in Buy Box share, especially during regional sales peaks.
Trigger 4: Performance Metric Fluctuations
Amazon adjusts rotation share in real-time based on recent performance. A seller maintaining 99.5% ODR might get 60% Buy Box share. If their ODR slips to 98.5%—still above the threshold but declining—their share might drop to 45%. When metrics recover, so does their rotation share.
Small performance dips trigger immediate rotation adjustments that sellers often fail to connect to their Buy Box fluctuations.
Trigger 5: Inventory Levels
Amazon reduces rotation share for sellers with low inventory due to stockout risk, increasing share for sellers with deeper inventory signaling reliable availability. A seller with 500 units might get 70% rotation; the same seller with 50 units—same price, same metrics—might see rotation drop to 40% as Amazon hedges against potential stockouts.
Trigger 6: Time-Based Factors
During peak shopping hours, rotation becomes more frequent as Amazon runs more A/B testing. Off-hours see more stable rotation. Promotional periods accelerate rotation as competitive positioning changes rapidly.
Sellers who check Buy Box status at the same time daily and assume their snapshot represents 24/7 reality are missing significant variation.
The Dangerous Misconceptions Costing Sellers Money
Several persistent misconceptions about rotation lead to poor decisions:
“I Lost the Buy Box” — Sellers think the Buy Box is binary. Reality: they likely still have eligibility and rotation share. “Losing” often means share decreased from 60% to 40%, not from 100% to 0%. This triggers panic pricing when investigation would be more appropriate.
“My Competitor Stole My Buy Box” — When sellers see a competitor in the Buy Box, they assume that competitor dominates. Reality: multiple sellers rotate. That competitor might only have 35% share while you have 40%. This leads to misguided competitive reactions.
“I Need the Lowest Price” — Sellers believe the lowest price wins the most rotation share. Research proves otherwise: sellers with better listings, stronger images, more reviews, and A+ Content win the Buy Box at higher prices. In rotation scenarios, sellers with better performance metrics and faster fulfillment often get higher shares despite charging more.
“Rotation Is Random” — Sellers think Amazon randomly distributes among eligible sellers. Reality: rotation is algorithmic and weighted. Sellers with better positioning get proportionally more time. A seller with excellent metrics, FBA fulfillment, and competitive pricing might get 50% share, while sellers with good or average metrics get 30% and 20% respectively.
“I See 100% When I Check, So I Have It” — Manual checking creates false confidence. Amazon may show you your own offer preferentially due to personalization. Geographic rotation means your location sees your offer more. Temporal checking misses rotation at other times. Actual share might be 60% when you believe it’s 100%.
How to Actually Optimize for Buy Box Rotation
With proper understanding, sellers can systematically increase their rotation share:
Exceed Performance Thresholds
Don’t just meet requirements—exceed them. Maintain ODR above 99%, not just above the 1% threshold. Keep late shipment rate under 2%, not just under 4%. Target response time under 12 hours, not just under 24. Moving from “meets requirements” to “exceeds requirements” increases rotation share disproportionately.
Optimize Geographic Distribution
For FBA sellers, send inventory to multiple fulfillment centers and use Amazon Warehousing and Distribution for optimal placement. Maintaining inventory depth across regions can yield 15-25% increases in overall Buy Box share from geographic optimization alone.
Manage Inventory Depth Strategically
The algorithm reads deep inventory as low stockout risk, making it safe to allocate more rotation share. Maintain 30+ days for normal share, 60+ days for preferred share. Below 15 days, the algorithm hedges by reducing your share. Reorder earlier than strictly necessary to maintain rotation share throughout your inventory cycle.
Monitor Rotation, Not Just Eligibility
Track Buy Box percentage by SKU hourly rather than through daily snapshots. Analyze trends over time, day-of-week patterns, and correlations with pricing and metric changes. Automated monitoring reveals patterns invisible in manual checks.
The Rotation Math: Why Higher Prices Sometimes Win
Consider this scenario: a competitor prices at $29.99 and gets 40% rotation. You price at $31.49—5% higher—but with superior metrics and fulfillment, you get 45% rotation.
The revenue comparison seems to favor matching price: $29.99 × 50 sales = $1,500 versus $31.49 × 45 sales = $1,417. But the margin comparison tells a different story: $1.50 better margin × 45 sales = $67.50 additional profit.
Depending on your margin structure, higher price with slightly lower rotation often wins on actual profit. This is the optimization most sellers miss when they panic-price to match competitors.
Understanding Rotation Dynamics: Amplification and Momentum
Two advanced concepts separate sophisticated sellers from reactive ones:
Rotation Amplification: When you improve multiple factors, rotation share increases more than proportionally because factors are weighted multiplicatively. Improving ODR from 98% to 99.5% might yield +5% share. Improving response time from 20 hours to 10 hours might add +4%. Combined, you might see +12%—not +9%—because the algorithm rewards comprehensive excellence.
Rotation Momentum: Higher rotation share generates better metrics, which increases rotation share further. Better listings lead to higher conversion during rotation time. The algorithm notices and increases your share. More sales improve velocity metrics and ratings. Better metrics earn even more rotation share. Small initial improvements compound over time—a 5% increase this week might become 15% in a month as momentum builds.
The Mindset Shift That Changes Everything
The fundamental reframe required: stop thinking “win or lose” and start thinking “maximize share.” On competitive listings, you’re not trying to beat competitors for 100% dominance. You’re trying to maximize your rotation share within a multi-seller ecosystem.
Rotation is algorithmic and weighted, not random. Multiple factors influence your share simultaneously. Small improvements compound through momentum. Geographic distribution remains the most underutilized optimization. Conversion rate during your rotation time determines future allocation. Continuous monitoring reveals patterns invisible in snapshots.
Sellers who understand rotation and optimize for it capture 20-30% more sales than sellers at similar price points who don’t. That’s the difference between 50% and 70% rotation share on products generating significant monthly revenue.
This is precisely where Zupricer transforms your approach to the Buy Box. Rather than reacting to rotation with panic repricing, Zupricer’s intelligent repricing platform monitors your actual rotation share in real-time, adjusting prices strategically to maximize both share and margin. The platform understands that you don’t need the lowest price—you need the optimal price that accounts for your fulfillment advantages, performance metrics, and competitive positioning.
Zupricer implements rotation-aware pricing automatically, protecting your margins while systematically increasing your Buy Box share through data-driven optimization rather than blind discounting. Stop guessing about rotation and start controlling it. Zupricer makes rotation work for you.