Here’s a scenario that plays out thousands of times every day: an Amazon seller sources a product, lists it at a “competitive” price, watches the sales roll in, and feels great about their business—until they actually run the numbers and discover they’ve been losing $2 on every single unit sold. Volume didn’t save them. It accelerated their losses.
This happens because most sellers don’t truly understand their break-even point. They approximate. They estimate. They hope. And hope is not a pricing strategy.
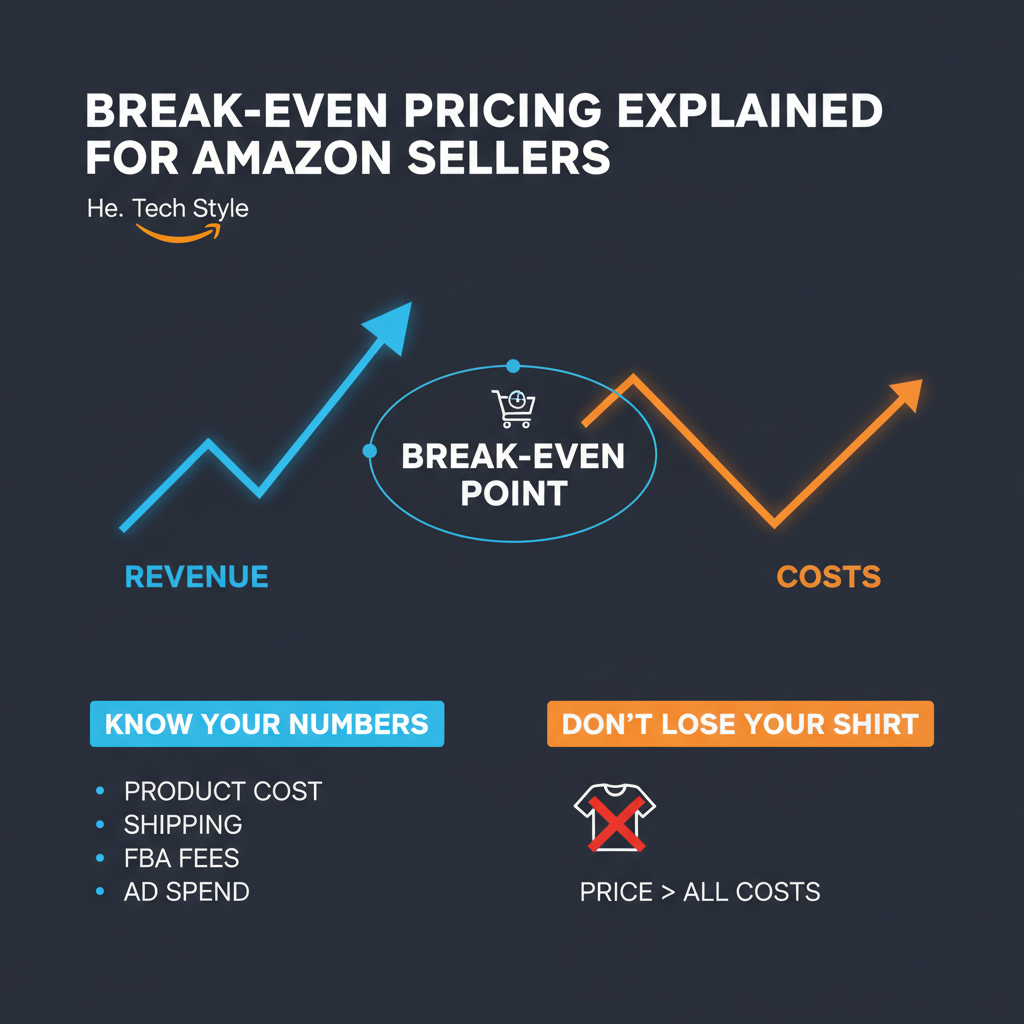
Break-even pricing is the exact price at which your total revenue equals your total costs—zero profit, zero loss. It’s not where you want to live permanently, but it’s the most important number you need to know. Without it, you’re flying blind on every pricing decision: product launches, inventory liquidation, competitive responses, and even determining which products deserve space in your catalog.
With amazon fees continuing to climb and margin pressure intensifying, sellers who master break-even analysis have a massive advantage over those who price by intuition. Let’s break down exactly how to calculate, use, and leverage your break-even point.
What Exactly Is Break-Even Pricing?
At its core, break-even pricing answers one question: What’s the absolute minimum price I can charge without losing money on this sale?
The formula sounds simple: Total Revenue = Total Costs. But the complexity lies in accurately capturing every cost associated with selling that unit. Most sellers undercount their costs, which means their “break-even” is actually a loss-making price.
Here’s why this number matters for strategic decisions:
- Product launches: Know how low you can price to build velocity without bleeding cash
- Inventory liquidation: Understand when selling cheap beats paying storage and removal fees
- Competitive response: Decide when to match a competitor versus sitting out a price war
- Portfolio management: Identify products that can never be profitable at market prices
- Advertising strategy: Calculate your break-even ACoS for profitable PPC campaigns
Break-even isn’t a pricing strategy—it’s the foundation that makes every other pricing strategy possible.
The Complete Break-Even Calculation Formula
Here’s where most sellers go wrong: they add up their obvious costs and call it break-even. But Amazon selling involves layers of fees, and missing even one can turn a “profitable” product into a money pit.
Costs You Must Include
Product and Inventory Costs:
- Cost of goods sold (what you pay per unit)
- Inbound shipping to Amazon FBA (total shipping ÷ units shipped)
- Prep and labeling costs
- Import duties and tariffs
Amazon Fees:
- Referral fee (typically 15% of sale price, varies by category)
- FBA fulfillment fee (based on size and weight tier)
- Monthly storage fees (prorated per unit)
- Long-term storage fees (if inventory sits over 365 days)
- Return processing fees (for categories with free returns)
- Professional seller subscription ($39.99/month prorated across units)
Variable Costs Often Forgotten:
- Average PPC advertising cost per unit sold
- Return and damage rate (typically 2-5% of units)
- Software and tool costs prorated per unit
The Formula That Actually Works
Here’s the catch: referral fees are calculated as a percentage of your sale price, not a fixed amount. This means you can’t simply add up costs—you need a formula that accounts for percentage-based fees:
Break-Even Price = (COGS + Fixed Fees + Variable Costs) ÷ (1 – Referral Fee % – Return Rate %)
Real Example:
- COGS: $12.00
- Inbound shipping: $0.80
- FBA fulfillment: $4.50
- Storage: $0.25
- Prorated subscription: $0.10
- Total fixed costs: $17.65
With a 15% referral fee and 3% return rate:
Break-Even = $17.65 ÷ (1 – 0.15 – 0.03) = $17.65 ÷ 0.82 = $21.52
Any price below $21.52 means you’re losing money on every sale. That’s your floor—the number you must know before making any pricing decision.
Break-Even vs. Target Pricing: Understanding the Gap
Your break-even price tells you where you start losing money. Your target price tells you where you start building a sustainable business. The gap between them represents your profit opportunity—and your pricing flexibility.
Industry benchmarks for healthy amazon margins in 2025 suggest targeting 15-30% profit margins. Using our example product with a 20% target margin:
Target Price = $17.65 ÷ (1 – 0.15 – 0.03 – 0.20) = $17.65 ÷ 0.62 = $28.47
The gap between break-even ($21.52) and target ($28.47) is nearly $7. That’s your strategic range—the space where you can compete aggressively when needed while still protecting profitability.
If your break-even price is close to or above competitive market prices, you have a fundamental problem that no pricing strategy can solve. Better to know this before ordering inventory than after.
When Break-Even Pricing Makes Strategic Sense
Break-even pricing should never be your default. It’s a tactical tool for specific situations with clear exit strategies.
Scenario 1: New Product Launches
Launching near break-even can build sales velocity, generate reviews, and improve organic ranking. But this only works if you have a documented plan to raise prices. Without an exit strategy, “temporary” launch pricing becomes a permanent race to the bottom.
Smart approach:
- Launch at break-even + 5-8% margin (not pure break-even)
- Set a maximum timeline: 30-60 days
- Define success metrics: target 15-25 reviews, specific ranking improvements
- Implement gradual price increases: 2-3% every two weeks
- Reach target margin within 90 days
Scenario 2: Inventory Liquidation
When you have aged or seasonal inventory approaching long-term storage fees, break-even analysis helps you make smart liquidation decisions.
Decision framework: If break-even is $22, long-term storage would cost $3/unit, and removal costs $0.50/unit, then liquidation makes sense at any price above $18.50. You’re recovering more than you would by paying fees and removing inventory.
Scenario 3: Competitive Price Wars
When a competitor drops prices aggressively, your break-even point tells you whether you can afford to follow. Sometimes the smart move is matching temporarily. Often, the smarter move is maintaining your price and waiting for them to run out of stock or cash.
Only compete at break-even if you have strong cash reserves, the competitor’s inventory appears limited, and you have a clear timeline for returning to profitable pricing.
Break-Even ACoS: The Advertising Calculation Most Sellers Miss
If you’re running PPC campaigns, you need to understand break-even ACoS (Advertising Cost of Sale)—the maximum percentage of revenue you can spend on advertising before the sale becomes unprofitable.
Formula: Break-Even ACoS = (Sale Price – All Costs Except Advertising) ÷ Sale Price × 100
Example:
- Sale price: $30
- All costs except advertising: $21
- Pre-ad profit margin: $9
Break-Even ACoS = $9 ÷ $30 × 100 = 30%
This means you can spend up to 30% of revenue on advertising before that sale loses money. Your target ACoS should be lower—typically 60-70% of your break-even ACoS—to maintain healthy margins. In this example, aim for 18-21% ACoS.
As Amazon fees continue rising, break-even ACoS thresholds are shrinking. What worked last year may not work today. Recalculate quarterly at minimum.
Common Calculation Mistakes That Destroy Margins
Even experienced sellers make these errors:
Forgetting percentage-based fees scale with price. If you calculate the referral fee based on one price and then lower your price, your math is wrong. Use the division formula that accounts for percentages automatically.
Ignoring advertising costs. PPC spend is a real cost that must be covered. Calculate your average ad cost per unit (total monthly ad spend ÷ total units sold) and include it in break-even calculations.
Overlooking return and damage rates. Even with FBA handling fulfillment, 2-5% of your inventory typically gets returned or damaged. That’s cost that needs to be priced into every unit.
Using outdated fee schedules. Amazon updates fees regularly. Using old calculations produces inaccurate break-even numbers. Verify current fees quarterly and update calculations immediately when Amazon announces changes.
Not prorating fixed costs. Your $39.99 Professional seller subscription needs to be distributed across units sold. At 500 units monthly, that’s $0.08 per unit—small but real.
Using Break-Even for Product Sourcing Decisions
Before committing to a new product, run break-even analysis against competitive market pricing:
- Competitive price $35, break-even $22: $13 gap (37% potential margin) → Good opportunity
- Competitive price $28, break-even $26: $2 gap (7% potential margin) → Risky, limited buffer
- Competitive price $25, break-even $27: Negative gap → Don’t source this product
For existing products, conduct monthly reviews. Has your break-even price increased due to fee changes? Has competitive pricing decreased? Is the gap between them narrowing? Products where break-even exceeds competitive pricing should be discontinued—you’re literally paying customers to take your inventory.
Conclusion: Know Your Numbers, Protect Your Business
Break-even pricing isn’t glamorous, but it’s the foundation of sustainable Amazon profitability. Sellers who know their break-even numbers make better decisions about launching, liquidating, competing, and advertising. Those who guess eventually discover they’ve been losing money while thinking they were succeeding.
The key principles: calculate break-even accurately including all costs, use it tactically rather than as a permanent strategy, maintain healthy gaps between break-even and target pricing, and monitor continuously as fees and costs change.
This is exactly where Zupricer becomes invaluable. With intelligent repricing that respects your profitability requirements and helps you set minimum price floors based on real break-even calculations, Zupricer ensures you never accidentally price yourself into losses. Stop guessing at profitability and start pricing with precision—Zupricer gives you the confidence that every sale contributes to your bottom line, not erodes it.
Multi-Channel Fulfillment and Break-Even Comparison: FBA vs FBM
Understanding break-even pricing becomes more complex when you’re deciding between fulfillment methods. Many Amazon sellers assume FBA is always the right choice, but the break-even point calculation often tells a different story depending on product characteristics.
The primary difference lies in the FBA fulfillment fee structure versus merchant-fulfilled costs. For lightweight, low-priced items, FBA fees can consume 30-40% of the sale price, making profitability nearly impossible. For these products, calculating your FBM break-even often reveals significantly better margins.
Calculating FBA vs FBM Break-Even
Consider a product selling for $15 with a cost of goods sold of $5. Under FBA, you might face a $3.50 fulfillment fee plus $2.25 referral fee (15%), leaving just $4.25 before accounting for storage, inbound shipping, and other costs. Your break-even might be $14.20, leaving minimal room for profit margins.
With FBM, you control fulfillment costs. If you can ship for $2.50 per unit, your break-even drops to $11.80, creating $3.20 more pricing flexibility. This gap represents the strategic advantage of understanding fulfillment-specific break-even calculations.
However, FBM comes with hidden costs many sellers overlook: packing materials, labor time, shipping software, customer service for delivery issues, and reduced Buy Box eligibility. Include these in your true FBM break-even calculation, or you’ll underestimate costs just as badly as sellers who ignore Amazon fees.
Seasonal Pricing Adjustments and Break-Even Analysis
Your break-even point isn’t static throughout the year. Seasonal fluctuations in storage fees, advertising costs, and competitive intensity mean your floor price changes with the calendar.
During Q4, storage fees remain relatively stable, but advertising costs spike dramatically. Your break-even ACoS calculation must account for PPC costs that may double or triple compared to off-season months. A product with 25% break-even ACoS in March might have just 12% break-even ACoS in November when ad costs surge.
Conversely, aged inventory approaching February and August faces long-term storage fee assessments. If you have 500 units sitting in FBA for 11 months, the impending $6.90 per cubic foot charge fundamentally changes your inventory liquidation math. Suddenly, selling at 5% below normal break-even makes perfect sense because avoiding the storage fee creates net savings.
Planning Seasonal Break-Even Shifts
Smart sellers build seasonal break-even calendars. Map your costs month by month, accounting for predictable fee changes and historical advertising cost patterns. This allows you to set dynamic minimum prices that protect profitability while remaining competitive.
For product launches, timing matters enormously. Launching in October means competing against elevated ad costs and established sellers with inventory momentum. Your break-even analysis should factor in 2-3x normal PPC costs, which might delay your launch until January when customer acquisition costs normalize.
Tax Implications on Break-Even Calculations
Most sellers calculate break-even on a pre-tax basis, but this creates blind spots in true profitability analysis. Sales tax collection, income tax obligations, and international VAT requirements all affect your real break-even threshold.
If you’re collecting sales tax in states where you have nexus, that revenue isn’t yours to keep. While Amazon handles collection and remittance, the economic reality is that your effective sale price is lower than the displayed price. A $30 sale with $2.40 sales tax is economically a $27.60 sale for break-even purposes.
For international sellers or those selling on Amazon’s European marketplaces, VAT creates additional complexity. A product with a £25 sale price includes roughly £4.17 in VAT (20% rate). Your break-even calculation must work backward from the net £20.83 you actually receive.
Income tax planning also intersects with break-even strategy. Operating at true break-even generates zero taxable income, which might be strategically valuable during competitive pricing battles or market entry. However, sustained break-even pricing creates no tax deductions for business losses, limiting your ability to offset other income.
Break-Even Analysis for Bundled Products
Product bundling creates unique break-even challenges because you’re combining multiple cost structures into a single sale price. The math becomes more complex, but the strategic opportunities multiply.
Consider bundling three items: Product A costs $4, Product B costs $6, and Product C costs $3. Individual break-even prices might be $12, $18, and $9 respectively (total $39). But bundled together, you face just one referral fee and one fulfillment fee instead of three, potentially dropping your combined break-even to $32-34.
This $5-7 gap represents pure pricing power. You can undercut competitors selling items individually while maintaining healthy margins, or you can match their total price and capture significantly higher profit per transaction.
The key is accurate bundle break-even calculation. Use the combined weight and dimensions for fulfillment fee estimation, apply the referral fee once to the total bundle price, and include any additional prep costs for creating the bundle. Many sellers forget to account for bundling labor, shrink wrap, or custom packaging, which erodes the margin advantage.
Tools and Software for Automated Break-Even Tracking
Manually calculating break-even for every product in your catalog is unsustainable once you exceed 20-30 SKUs. Automation becomes essential for maintaining accurate profitability floors as fees change and costs fluctuate.
Effective break-even tracking software should pull real-time fee data from Amazon, integrate with your inventory management system for current COGS, and automatically recalculate break-even prices when any input changes. The best solutions alert you when competitive prices drop below your break-even threshold, preventing accidental race-to-the-bottom scenarios.
Integration with your Amazon repricing tool creates a powerful safety net. By feeding accurate break-even calculations into your repricing rules, you ensure automated price changes never sacrifice profitability for competitiveness. This is where understanding your numbers and implementing smart automation converge into sustainable pricing strategy.